Trusted Digital Transformation Partner
Oracle Performance Tuning Is Not About SQL, It Is About the Entire Ecosystem
- By Virender Kumar, Head of Cloud & Database
- Published Jul 13, 2026
Oracle performance tuning is an ecosystem discipline, not just SQL — materialized views, Linux ulimit, kernel parameters, SGA/PGA sizing & tuning cycle.
Two databases can run on identical CPU and identical RAM and still perform nothing alike. The difference is almost never the hardware, and it is rarely the SQL alone. Oracle performance is built at every layer — operating system, memory, network, storage, statistics, execution plans and query design — and it is only ever as fast as the weakest one.
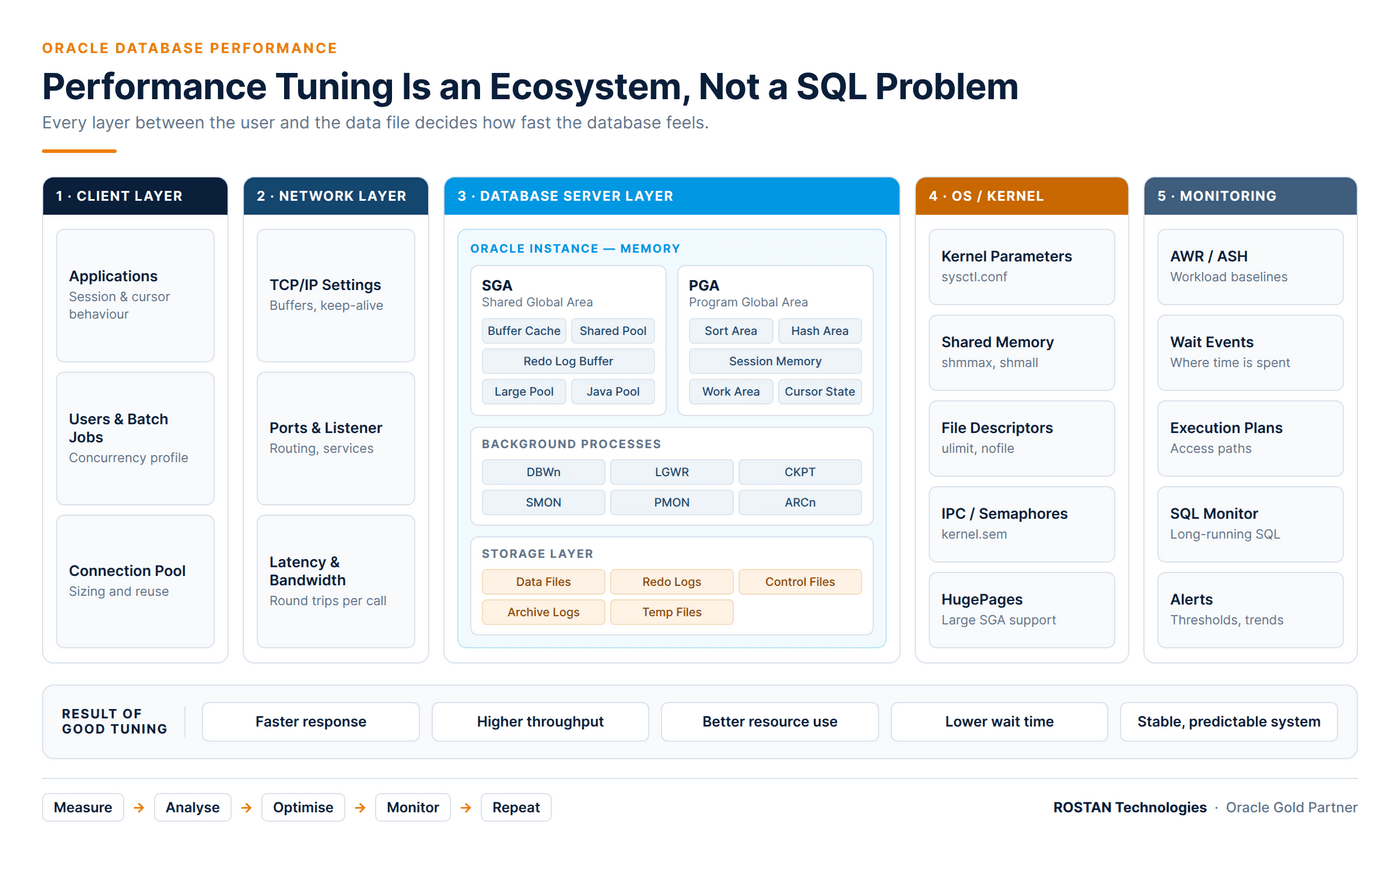
In short: Oracle database performance tuning is not just SQL tuning. It is an ecosystem discipline covering five layers: the client and connection pool, the network, the database server itself (SGA, PGA, background processes, storage), the Linux operating system and kernel, and continuous monitoring. The five changes with the largest payoff for the least effort are materialized views in place of repeatedly executed complex views, correct ulimit settings, tuned kernel parameters in sysctl.conf, correctly sized SGA and PGA, and treating tuning as a continuous cycle rather than a one-time fix.
Most tuning starts far too late
In most organisations, tuning begins the moment users start complaining. The application is slow. The report that used to take two minutes now takes twenty. The database appears to hang at month end. By then the team is reacting to a symptom, and the search inevitably narrows to the last thing that changed — usually a query.
Experienced DBAs work from a different assumption. Performance is not repaired at the SQL level; it is designed in at every level. A powerful engine will not win a race if the tyres are worn, the fuel flow is restricted or the aerodynamics are wrong. An Oracle database behaves in exactly the same way: a well-written query still crawls if the operating system is starving it of file descriptors, if the SGA is too small to hold the working set, or if the storage cannot keep up with the redo it is being asked to write.
Five changes with outsized impact
1. Use materialized views instead of complex views, where appropriate
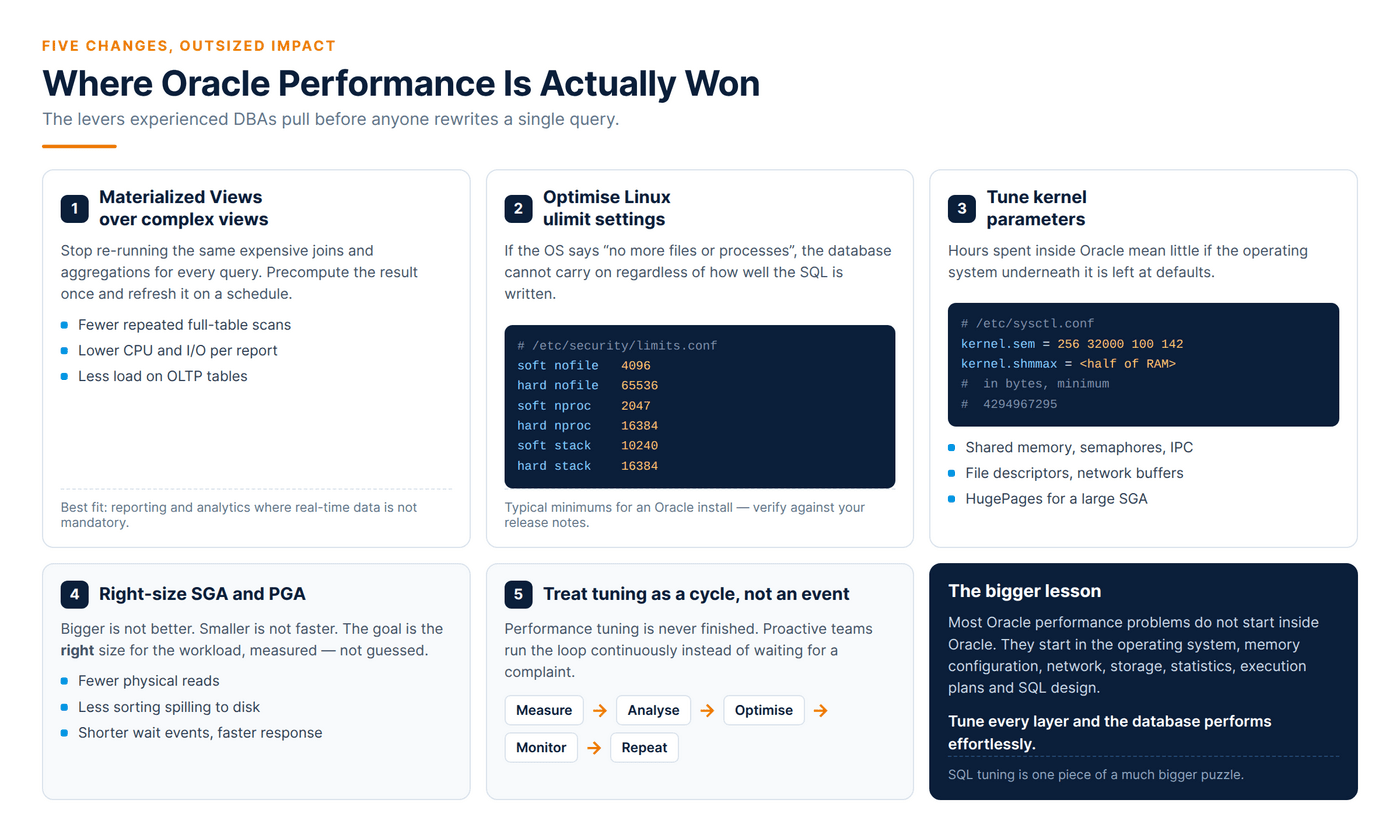
If the same expensive joins, aggregations and calculations are executed on every single query, the database is paying the same bill over and over again. A materialized view stores the precomputed result and refreshes it periodically, so the work is done once rather than on every call.
- Eliminates repeated full-table scans and joins — the heavy work happens at refresh time, not query time.
- Reduces CPU, I/O and query execution time — reads hit a compact, pre-aggregated result set.
- Improves report performance on large datasets — particularly where the same aggregate is requested by many users.
- Reduces load on OLTP tables during reporting — reporting stops competing with transactions for the same blocks.
The trade-off is data freshness. Materialized views are best suited to reporting and analytics workloads where real-time accuracy to the second is not mandatory, and where a scheduled or fast refresh is acceptable to the business.
2. Optimise Linux ulimit settings
When the operating system says there are no more files or processes available, the database cannot continue by force of will. Oracle processes need generous limits on open files, user processes and stack size to handle real concurrency, and the defaults on most Linux builds are set for a general-purpose server, not a database server.
Typical minimum values in /etc/security/limits.conf for an Oracle installation are:
soft nofile   4096
hard nofile   65536
soft nproc    2047
hard nproc    16384
soft stack    10240
hard stack    16384
Setting nofile, nproc and stack correctly lets Oracle carry higher workloads without hitting artificial ceilings. Always confirm the required values against the installation guide for your specific Oracle release and platform, as they do change between versions.
3. Tune the kernel parameters
Many DBAs spend hours tuning inside Oracle and never look at the operating system underneath it. Kernel settings govern shared memory, semaphores, file descriptors, network buffers and HugePages — every one of which the database depends on.
Two entries in /etc/sysctl.conf matter more than most:
kernel.sem   = 256 32000 100 142
kernel.shmmax = <half of physical memory, in bytes>
kernel.shmmax should be set to half the size of physical memory expressed in bytes, subject to the minimum required by your Oracle version (commonly 4294967295 bytes). Getting this wrong does not always produce an obvious error — it can quietly prevent the instance from allocating the SGA it was configured for, which then looks like a memory problem inside Oracle when the cause is entirely outside it. On systems with a large SGA, enabling HugePages is one of the highest-return kernel-level changes available.
4. Size the SGA and PGA correctly
Bigger is not automatically better and smaller is not automatically faster. The objective is the right size for the actual workload, arrived at by measurement rather than by rounding up.
Correct memory sizing directly reduces:
- Physical reads — a properly sized buffer cache keeps the working set in memory instead of going back to disk.
- Sorting on disk — adequate PGA keeps sorts and hash joins in memory rather than spilling to temp.
- Wait events — less contention for memory structures and fewer I/O waits.
- Response time — the cumulative effect of all of the above, visible to the end user.
Oversizing carries its own cost: memory taken from the operating system and other processes, longer instance startup, and in some cases more contention rather than less. Use AWR and ASH data to size against the workload you actually have.
5. Treat tuning as a cycle, not an event
Performance tuning is not a one-time activity that is finished when the ticket closes. Workloads grow, data volumes shift, statistics go stale and execution plans change underneath you. The discipline that separates proactive teams from reactive ones is a continuous loop: measure, analyse, optimise, monitor, repeat.
Reactive DBAs tune when someone complains. Proactive DBAs already know which SQL has regressed, which wait event is climbing week on week, and which segment is about to outgrow its storage — because they never stopped measuring.
The bigger lesson: most Oracle problems do not start inside Oracle
When a database is slow, the instinct is to look at the database. But the root cause frequently lives somewhere else entirely:
- Operating system — limits, kernel parameters, scheduling, swap.
- Memory configuration — SGA and PGA sizing, HugePages.
- Network — latency, round trips per call, listener and connection pool behaviour.
- Storage — I/O throughput, redo write latency, ASM configuration.
- Statistics — stale or missing statistics that mislead the optimiser.
- Execution plans — plan regressions, poor access paths, missing or unusable indexes.
- SQL design — the query itself, which is one piece of the puzzle rather than the whole of it.
SQL tuning matters. It simply is not the only thing that matters. When every layer is tuned in concert, Oracle stops being something you fight with and starts performing effortlessly under load.
Questions worth asking your team
- Which single tuning activity has delivered the biggest measurable improvement in your environment — SQL tuning, AWR analysis, SGA and PGA sizing, materialized views, HugePages, or kernel parameters?
- Do you tune when a user complains, or do you have a baseline that tells you performance has drifted before anyone notices?
- When did you last verify that your operating system limits and kernel parameters still match the Oracle release you are running?
- If reporting queries were removed from your OLTP tables tomorrow, how much headroom would that release?
Get a full-ecosystem Oracle performance review
ROSTAN is an Oracle Gold Partner. Our DBA team reviews performance across the entire stack — operating system, kernel, memory, storage, statistics, execution plans and SQL — and delivers a prioritised, measurable tuning plan rather than a list of queries to rewrite. Talk to our Oracle database team.
Oracle EBS & Database Services
Most Oracle performance problems do not start inside Oracle. We tune the whole ecosystem — SGA and PGA sizing, kernel parameters, storage and SQL.
See our Oracle EBS practiceFrequently Asked Questions

Get a free Oracle Health Check
Our Oracle Gold Partner experts review your EBS, Fusion Cloud or APEX environment and send a written report on performance gaps, cost savings and upgrade risk.
Have questions about Oracle, AWS or Cloud?
Talk to our certified experts — free consultation, no commitment.
Recent Post




Talk to an Oracle DBA
Performance, patching, cloning, upgrades or recovery — describe the symptom and we will tell you what usually causes it and what it takes to fix properly.